Why Your Latest YouTube 1 of 10 Might Be Misleading


YouTube changed the number you’re judging yourself by
Hey,
This week, I was on a call with the GrowVeg team, a gardening channel I’ve helped grow past a million subscribers.
They were excited about their latest two videos. Their new garden tour had passed 126,000 views in less than four days and was showing as a 1 of 10.
That’s the ranking you want to see with your latest video beating the previous nine at the same point after publication.
Then it was my turn to share my screen.
“I don’t want to pop your bubble,” I said.
On 24 August, YouTube started counting a view from the very first frame, even when a video begins autoplaying without someone clicking on it.
The previous view measure is now called Engaged views inside ‘Advanced Analytics’. It counts someone clicking or tapping to watch, or continuing beyond the opening seconds of autoplay.
The good news was that, even on Engaged views, this was still a 1 of 10 video. People were watching for around nine minutes on average. There was plenty to be pleased about.
But we needed to separate how well the video was doing from how much bigger YouTube had made the number.
I’ve been having versions of this conversation with clients over the past couple of weeks. And the answer isn’t always as reassuring.
With another client, what looked like their best start yet was much closer to their usual performance once we checked Engaged views.
If you’ve had a run of unusually strong view counts recently, it’s worth doing the same check before deciding what worked.
1. What this changes about your next upload
The headline Views number now tells you more about how often playback started. It can’t, by itself, tell you how many of those starts turned into someone spending meaningful time with your video.
You can see why this matters when you’re testing a new idea.
Say you’ve changed your thumbnail style, shortened your intro and tried a different topic. Then the next upload gets a much bigger view count.
Which change worked?
Before you start making five more videos in that style, you need to establish how much of the apparent improvement is actually there.
A reporting change gives you a different number but it doesn’t establish that YouTube is recommending your videos more widely, or that your new approach is working better.
2. The bigger problem is what you start expecting
This is what I warned about in the Reel I made before the change.
Imagine your usual view count suddenly doubles under the new counting method.
You know about the update, so you tell yourself to take the bigger number with a pinch of salt.
But after a few uploads, that bigger number starts to feel normal.
Now an upload gets your old usual number and you’re disappointed. You’re questioning the idea, wondering whether the thumbnail needs changing, or thinking your channel has gone backwards.
You could be doing that while the amount of meaningful viewing is holding steady or improving.
Your expectations can change faster than your audience does.
That’s why knowing about the update isn’t enough, as you need to change the number you use when deciding what to repeat, what to fix and what to stop doing.
The gap between Views and Engaged views also varies from video to video. You can’t correct it by halving every number or applying some other fixed formula. You need to look at the actual figures.
3. Put Engaged views into your launch review
YouTube still calculates average view duration and average percentage viewed from engaged views and their associated watch time.
When you next review an upload, open YouTube Studio → Analytics → Advanced mode and select your video. You can also get there through See more.
Open Metrics on the left, or click the + above the table. Tick Engaged views alongside Views, Average view duration and Average percentage viewed, then click Apply.
Here’s the menu in my own Studio.
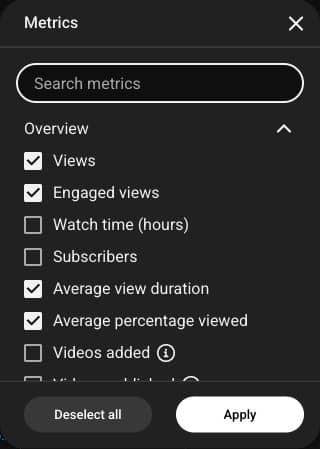
You’ll have the headline count and the engaged count in the same table, alongside how long people watched. The layout may look slightly different while Studio’s updated interface rolls out.
Then make the comparison fair.
- Use the same metric for both videos.
- Compare the same point after publication, such as the first seven days.
- Compare similar formats, so a Short isn’t being judged against a long tutorial.
Be particularly careful with a recent headline Views total against an older average built under the previous definition.
Your historical Analytics date ranges are still there. Start by checking the comparable measures available in Studio, rather than assuming your old data has become useless or waiting for an arbitrary number of new uploads.
I also wouldn’t make a big production decision from an outlier multiplier without checking what went into it. A tool comparing public view counts needs those counts to be comparable for the result to mean what you think it means.
4. Find the improvement you can actually repeat
Here’s how I work through a launch with a client.
- Views. How often did playback start?
- Engaged views. How often did someone click to watch or continue beyond the opening seconds?
- Retention. Where did people stay, leave or skip?
- Leads and sales. Is there evidence that the right viewers took the next step towards working with you?
Each question helps you make a different decision. A bigger first number doesn’t answer the other three.
That’s why I could still be positive about GrowVeg’s video after explaining the change.
We checked the engaged performance, the click-through rate and how long people were watching. The video was still doing well on the measures we’d been using to judge their work before the update.
For your next upload, check Engaged views and the retention curve before deciding you’ve had a breakthrough or a flop.
Then ask yourself what the evidence tells you to do differently next time.
I recorded a short explanation of this before the rollout. Watch the Reel on Instagram here, and follow me there if you’d like more practical YouTube breakdowns between these emails.
Jamie
P.S. Have you checked the gap between Views and Engaged views on your latest upload? Hit reply and tell me what you found.

Put these ideas into practice.
Get The Million-View Blueprint, my free five-day email course to help you make better YouTube videos.
You can read all my previous newsletters here →
Keep reading
A weekly dose of The Creator Stream, where we learn to craft irresistible video ideas and supercharge your titles & thumbnails! Join over 1,750 Creators!